Why a Single Market Health Score Matters
Crypto markets cycle between regimes — deep bear, early recovery, confirmed bull, euphoric top — and the optimal strategy differs dramatically in each phase. Buying dips works in a bull market but destroys capital in a bear. Shorting rallies works in a downtrend but gets squeezed in a confirmed uptrend. The challenge is that no single indicator reliably identifies the current regime on its own.
Moving averages lag by weeks. Sentiment gauges spike on noise and revert before you can act. On-chain metrics like exchange flows can diverge from price action for months before resolution. Relying on any one signal leads to whipsaws and false positives.
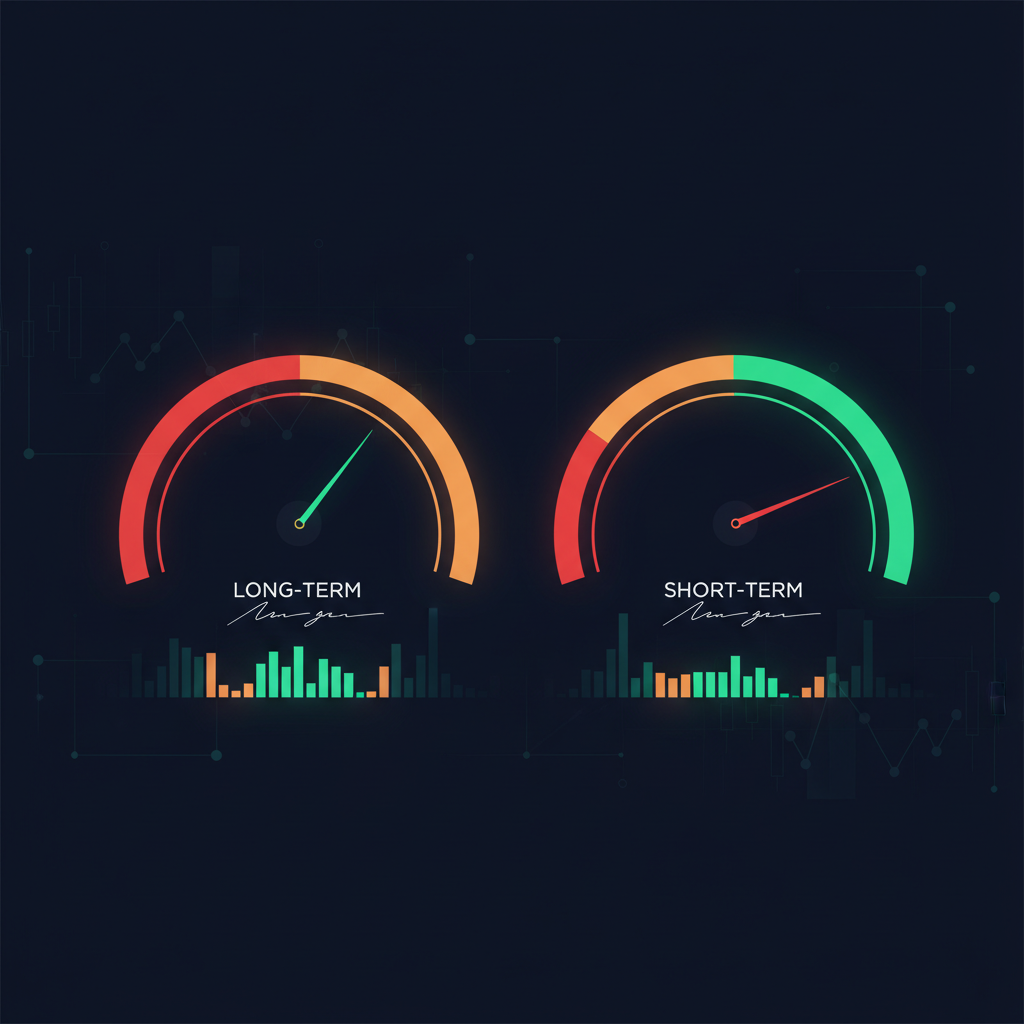
The Crypto Data API Market Health Score solves this by combining 11 independent components into two composite scores: a long-term score for structural positioning and a short-term score for tactical timing. Together, they classify the market into one of five regimes with a single API call, giving your bot or AI agent a quantitative regime label it can act on directly.
curl -H "X-API-Key: YOUR_KEY" \
  https://cryptodataapi.com/api/v1/health/market-health-score

# Response
{
  "long_term_score": 72,
  "short_term_score": 58,
  "regime": "confirmed_bull",
  "components": { ... },
  "updated_at": 1739500800
}
Long-Term Score: Structural Market Position
The long-term score (0 – 100) captures the structural health of the crypto market by weighting indicators that move on weekly-to-monthly timeframes. It answers the question: Where are we in the macro cycle? This score changes slowly and is designed to keep your strategy on the right side of the dominant trend.
Components feeding the long-term score include:
- 200-Week Moving Average Heatmap — measures BTC price relative to its 200-week MA and the rate of change of that MA to gauge long-term trend direction and overextension. Historically, price touching the 200-week MA during a cooling period has been a generational buying opportunity.
- 2-Year MA Multiplier — compares price to the 2-year moving average and its 5x multiple to identify cycle bottoms and tops. The upper and lower bands define the broad envelope of each cycle.
- Puell Multiple — tracks daily miner revenue relative to the 365-day average, signaling miner capitulation (values below 0.5) or euphoria (values above 4.0). This metric captures the economic stress on the supply side of the network.
- Stock-to-Flow Deflection — measures how far price has deviated from the stock-to-flow model prediction. While the model is debated, the deflection metric remains useful as a mean-reversion signal within cycles.
- Pi Cycle Top Indicator — monitors the convergence of the 111-day and 350-day x2 moving averages, historically accurate at calling cycle peaks within days. When these lines cross, the indicator fires a top signal.
- Rainbow Chart Band — maps price to a logarithmic regression band to classify whether the market is in an accumulation zone, fair value, or distribution territory.
Each component is independently normalized to a 0 – 100 scale and then weighted based on historical predictive accuracy. The composite long-term score updates every 30 minutes as fresh data arrives from upstream collectors. This cadence balances freshness with the inherently slow-moving nature of these structural indicators.
Short-Term Score: Tactical Timing
The short-term score (0 – 100) focuses on fast-moving derivatives and sentiment data to answer: What is the market doing right now, and how crowded is the trade? While the long-term score tells you the phase of the cycle, the short-term score tells you whether the current moment within that phase is overextended or washed out.
Components include:
- Aggregate Funding Rate — weighted average perpetual futures funding across major exchanges including Binance, Bybit, OKX, and Hyperliquid. Persistently positive funding signals leveraged-long crowding; deeply negative funding signals panic or short crowding.
- Open Interest Change (24h) — rapid OI increases during rallies often precede liquidation cascades when the move reverses. Declining OI during rallies suggests the move is driven by short covering rather than new long conviction.
- Long/Short Ratio — aggregated across Binance, Bybit, and OKX to measure retail positioning. When the ratio exceeds 2.0, the crowd is overwhelmingly on one side and a contrarian signal is forming.
- Fear & Greed Index — a sentiment composite that captures social media activity, volume, volatility, dominance, and search trends. Extreme fear (below 20) has historically marked local bottoms; extreme greed (above 80) has preceded corrections.
- Stablecoin Flow Index — net stablecoin movement to exchanges, indicating potential buying pressure when inflows rise or capital withdrawal when outflows dominate.
Trade derivatives on Binance — the largest derivatives exchange by volume. Create your account to access futures, options, and margin trading with deep liquidity. Binance derivatives data feeds directly into our short-term health score.
The short-term score is particularly useful for timing entries and exits within an established long-term regime. When the long-term score says “bull market” but the short-term score drops below 30, it often signals a buying opportunity on a pullback — the kind of dip that shakes out weak hands but does not change the structural trend.
Access Hyperliquid OI data — our API tracks open interest from Hyperliquid in real time. Start trading on Hyperliquid to see these signals in action on the fastest-growing on-chain derivatives exchange.
Our link gives you 4% discount on spot and perpetual trading fees. Referral link — CryptoDataAPI may earn a commission on referred signups, at no extra cost to you.
Five Regime Classifications
The dual-score system maps to five market regimes, each with distinct characteristics and strategic implications. Understanding which regime you are in is the single most important decision for any trading strategy — it determines whether you should be aggressive, defensive, accumulating, or distributing.
| Regime | Long-Term | Short-Term | Characteristics |
|---|---|---|---|
| Bear | 0 – 25 | Any | Price below key MAs, miner capitulation, negative sentiment. Accumulation phase for long-term holders. Trading focus should be capital preservation and selective accumulation. |
| Early Recovery | 25 – 45 | > 40 | First signs of structural improvement. 200W MA slope flattening, Puell Multiple rising from lows. Risk-reward for new longs becomes favorable. Reduce cash allocation gradually. |
| Early Bull | 45 – 65 | > 50 | Confirmed trend change. Price above major MAs, increasing OI, positive funding. This is where trend-following strategies should be fully deployed with controlled leverage. |
| Confirmed Bull | 65 – 85 | > 45 | Strong uptrend with broad participation. High conviction zone for trend-following strategies. Short-term pullbacks are buying opportunities as long as the long-term score holds. |
| Topping Out | > 85 | < 40 | Long-term overextension meets deteriorating short-term internals. Pi Cycle and Rainbow at extremes. Begin scaling out of positions, raising stops, and reducing leverage. |
The regime classification is returned as a string in the API response alongside both scores, making it trivial for trading bots to branch logic by market phase. A simple if regime == "confirmed_bull" check replaces hundreds of lines of manual indicator analysis.
Integrating the Health Score into Your Bot
Here is a practical example of using the market health score to gate a trading strategy. This pattern separates regime detection from signal generation, keeping your code modular:
import httpx

async def should_enter_long(api_key: str) -> bool:
    """Only enter longs in bull regimes with short-term dip."""
    async with httpx.AsyncClient() as client:
        r = await client.get(
            "https://cryptodataapi.com/api/v1/health/market-health-score",
            headers={"X-API-Key": api_key}
        )
        data = r.json()

    regime = data["regime"]
    st_score = data["short_term_score"]

    # Enter longs only in bull regimes on short-term pullbacks
    if regime in ("early_bull", "confirmed_bull") and st_score < 35:
        return True
    return False


async def position_size_multiplier(api_key: str) -> float:
    """Scale position size based on regime confidence."""
    async with httpx.AsyncClient() as client:
        r = await client.get(
            "https://cryptodataapi.com/api/v1/health/market-health-score",
            headers={"X-API-Key": api_key}
        )
        data = r.json()

    lt = data["long_term_score"]
    if lt > 70: return 1.0    # full size in confirmed bull
    if lt > 50: return 0.6    # moderate in early bull
    if lt > 30: return 0.3    # small in recovery
    return 0.1               # minimal in bear
This pattern keeps your strategy aligned with the macro trend while timing entries on short-term weakness — a combination that historically outperforms simple momentum approaches by avoiding entries at local tops and sizing positions appropriately for the cycle phase.
Accessing Individual Components
While the composite scores are ideal for automated decision-making, you can also access each component individually for custom weighting, visualization in dashboards, or feeding into your own machine learning models:
curl -H "X-API-Key: YOUR_KEY" \
  https://cryptodataapi.com/api/v1/health/market-health-score

# The components object breaks down every input
{
  "long_term_score": 72,
  "short_term_score": 58,
  "regime": "confirmed_bull",
  "components": {
    "puell_multiple": {"value": 1.35, "normalized": 68},
    "stock_to_flow": {"value": 0.82, "normalized": 71},
    "pi_cycle_top": {"value": 0.15, "normalized": 80},
    "rainbow_band": {"value": 4, "normalized": 65},
    "two_year_ma": {"value": 1.8, "normalized": 70},
    "two_hundred_week_ma": {"value": 1.45, "normalized": 75},
    "funding_rate": {"value": 0.0001, "normalized": 55},
    "open_interest_change": {"value": 0.03, "normalized": 52},
    "long_short_ratio": {"value": 1.15, "normalized": 48},
    "fear_greed": {"value": 62, "normalized": 62},
    "stablecoin_flow": {"value": 0.02, "normalized": 58}
  }
}
Each component includes its raw value and its 0 – 100 normalized score, so you can audit exactly how the composite is being calculated and override weights for your own models. This transparency is essential for building trust in automated systems — you can always explain why the health score is at a particular level.
A Systematic Edge in Regime Detection
Markets reward those who adapt to changing conditions and punish those who apply the same strategy regardless of regime. The dual-score market health system gives traders and AI agents a structured, quantitative framework for regime detection — no subjective chart reading required.
The long-term score keeps you on the right side of the macro cycle. The short-term score refines your timing within that cycle. Together, they provide a decision layer that works for discretionary traders, systematic bots, and LLM-based agents alike.
Access the full market health score today and build regime-aware strategies that adapt automatically as market conditions evolve. One API call, two scores, five regimes — the simplest way to make your trading strategy cycle-aware.