Why a Daily Trend Radar Beats Staring at 100 Charts
A daily trend radar indicator for crypto answers one question at a glance: which coins are actually trending right now, which are chopping sideways, and which just flipped direction? Stare at 100 daily charts and your eyes glaze over by coin 12. Worse, you end up trading the first chart that looks interesting rather than the best one.
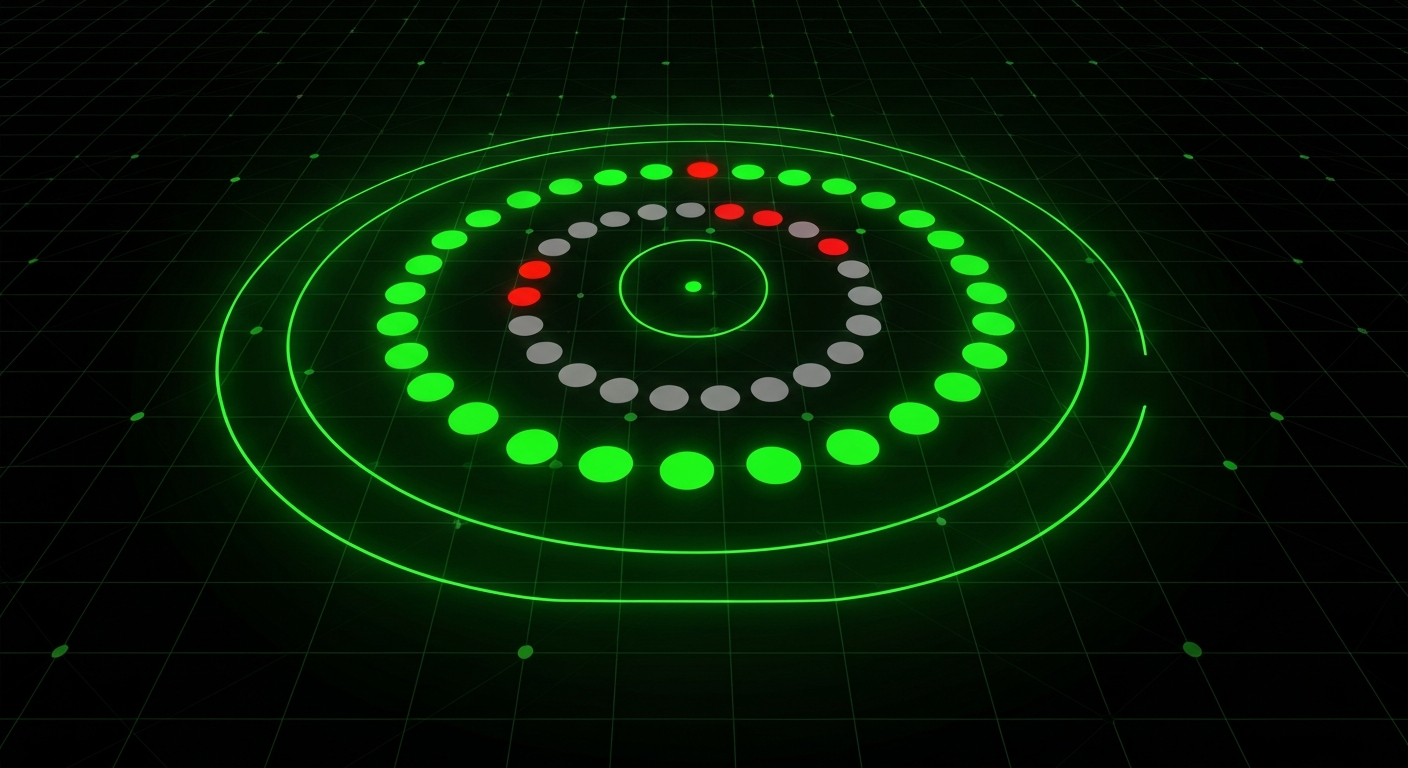
The SIGNUM RGG indicator solves this by giving every tradeable coin a single daily color: GREEN (uptrend), GREY (sideways), or RED (downtrend). You see hundreds of tickers at once on the live radar page, sortable by how fresh the flip is, how much price has moved since the flip, and — for grey assets — how tight the current consolidation range is.
The point isn't to replace chart-reading. It's to shortlist the five coins that are worth chart-reading today.
How SIGNUM RGG Classifies Every Coin Red, Grey, or Green
The classification is a dead-simple ADX + DMI rule applied to daily closes, with a hysteresis band to kill whipsaws. No magic, no ML, no overfitting.
ADX(14) ≥ 25 and +DI > -DI→ GREENADX(14) ≥ 25 and -DI > +DI→ REDADX(14) < 20→ GREY20 ≤ ADX < 25→ hold the prior color (hysteresis)
That's it. ADX measures how much a market is trending; +DI vs -DI says which way. When ADX is weak, direction is statistical noise, so the coin is grey. When ADX rips past 25 with +DI leading, it's a real uptrend. The hysteresis band between 20 and 25 stops the signal from flapping green-grey-green-grey on a single ADX print.
Two extras turn the classifier into a useful tool. First, every coin reports its flip date — the bar the current color began — plus days in color and % change since the flip. Second, grey coins report their 20-day consolidation range (low, high, width %) so you can see which ones are coiled tight and ripe for a breakout.
Four Trade-Actionable Patterns the Indicator Surfaces
Color alone is not a signal. The combination of color, days, and % move is.
- Fresh green flip (
color=green, days_in_color ≤ 3) — the cleanest early-entry setup. Price hasn't run far yet and the ADX/DI structure just confirmed strength. This is where edge lives. - Late-stage green (
color=green, days_in_color ≥ 21, pct_change_since_flip ≥ 30%) — trend is real but most of the move has happened. The risk/reward of joining at this stage is skewed against you. Better to trim than to add. - Tight grey coil (
color=grey, range.width_pct ≤ 10%) — a coiled spring. Watch the range high for a breakout; watch the range low for a breakdown. Many of the best trending entries start here. - Fresh red flip on a previously green coin (
color=red, days_in_color ≤ 3) — a regime change. Exit longs, consider shorts, and pay close attention to related coins that often follow.
Every query to the radar returns these fields pre-computed so you can filter directly:
GET /api/v1/indicators/signum-rgg?color=green&max_days=3&sort=pct_change&order=ascThat one call gives you every fresh-green-flip coin ordered by how little price has moved yet — your early-entry watchlist for the day.
How Do AI Agents Use the Trend Radar?
AI trading agents and research assistants have the same problem human traders do: too many tickers, not enough attention. A trend radar is ideal agent input because the output is structured, small, and actionable.
Three common agent workflows:
- Regime filter — before placing any trade, the agent pulls
/api/v1/indicators/signum-rgg/{symbol}and rejects entries whose color contradicts the intended direction. Long setups on red coins get filtered out; short setups on green coins likewise. - Daily briefing — a morning cron hits
/api/v1/indicators/signum-rgg?color=green&max_days=2and?color=grey&sort=adx&order=ascand emails a two-list digest: what just flipped and what's coiling. - Exit trigger — for every open long, the agent watches the
colorfield on a daily poll. A green → grey transition is a reduce signal; green → red is a full exit.
Because the indicator refreshes once per daily close, agents can cache results for 24 hours without any freshness risk. No websocket, no rate-limit juggling.
Daily Trend Radar vs Moving-Average Crossover
Most trend filters in public circulation are simple MA crossovers (e.g. 20-day over 50-day) or a single-MA-slope rule. The ADX + DMI approach behind SIGNUM RGG is a strict upgrade for three reasons.
| Property | MA Crossover | SIGNUM RGG (ADX+DMI) |
|---|---|---|
| Distinguishes trend from range | No — always a binary above/below | Yes — explicit GREY state |
| Whipsaw protection | Lag only — flips on every small cross | Hysteresis band 20–25 holds prior color |
| Trend strength info | None — only direction | ADX value ships with every row |
| Range breakout detection | Not natively — needs extra logic | 20-day Donchian range on every grey asset |
The grey state is the important upgrade. Markets spend most of their time in range, not in trend — a binary indicator forces you to trade during those ranges, which is where strategies bleed. An explicit grey label tells you to wait for the breakout instead of front-running it.
Calling the Trend Radar from a Trading Bot
The endpoint is a single REST call. Two examples — a curl one-liner and a Python snippet for an automated bot.
curl — today's fresh green flips
curl "https://cryptodataapi.com/api/v1/indicators/signum-rgg?color=green&max_days=3&limit=20" \
     -H "X-API-Key: cdk_live_YOUR_KEY"
Python — agent regime filter
import httpx

API = "https://cryptodataapi.com"
HEADERS = {"X-API-Key": "cdk_live_YOUR_KEY"}

def trend_color(symbol: str) -> str:
    """Return 'green', 'grey', or 'red' for a coin's current daily trend."""
    r = httpx.get(f"{API}/api/v1/indicators/signum-rgg/{symbol}", headers=HEADERS)
    r.raise_for_status()
    return r.json()["color"]

def can_go_long(symbol: str) -> bool:
    return trend_color(symbol) == "green"
Each row in the response includes symbol, color, days_in_color, flipped_at, pct_change_since_flip, price, adx, plus_di, minus_di, and — for grey assets — range.low, range.high, and range.width_pct. The detail endpoint also returns a 60-day color history suitable for plotting a trend-strip under a chart.
The radar covers every liquid Binance USDT pair (≥$100K/day volume) plus all Hyperliquid perps, deduped — Binance Spot wins on overlap. Universe size is typically ~600 assets. Refreshes once per day at 00:10 UTC after the daily candle close.
When to Use It, When to Skip It
Use the radar for:
- Swing-trading watchlist construction — filter to GREEN coins with
days_in_color ≤ 5and you have today's candidate list. - Regime-gating a bot — refuse to open longs against a RED color, refuse shorts against GREEN.
- Breakout scanning — sort grey coins by
range.width_pctascending and you have the tightest coils in the universe. - Exit management — a GREEN → GREY flip on your position is an early warning, often before price confirms weakness.
Skip it for:
- Intraday trading — it's a daily-timeframe indicator. Intraday moves don't change the color until the next daily close.
- Stablecoin or pegged-asset signals — the ADX math is mechanically correct on USDC or FDUSD but the output is meaningless peg noise.
- Brand-new listings — the radar requires 30+ daily bars to compute, so coins listed in the last month are skipped.
- Entry timing — it's a trend filter, not an entry signal. Combine it with funding, volume, or your own trigger.
See the live radar visualisation on the Coin Trends page, or pull the full indicator programmatically via /api/v1/indicators/signum-rgg with a Pro Plus key. Pair it with our Crypto Market Health Analysis for a top-down read on whether the overall regime supports the coin-level trends you're seeing.