
Crypto Exchange API Directory: Programmatic Sign-Up Links for Trading Bots
Your agent just pulled live funding and open-interest data for a user about to trade. Where does it send them to actually open the account — and how does it avoid hallucinating the link?
Read more →
Crypto Market Data API for a Trading Agent: Candles, Funding, OI
An agent that only sees price is guessing. Candles tell it where price has been, funding tells it what positioning costs, open interest tells it how crowded the trade is. Three calls, one key.
Read more →
The Crypto News API That Measures Price Impact, Not Sentiment
Most crypto news feeds tag sentiment on everything. Ours filters hundreds of daily stories down to real catalysts, then measures whether price actually moved.
Read more →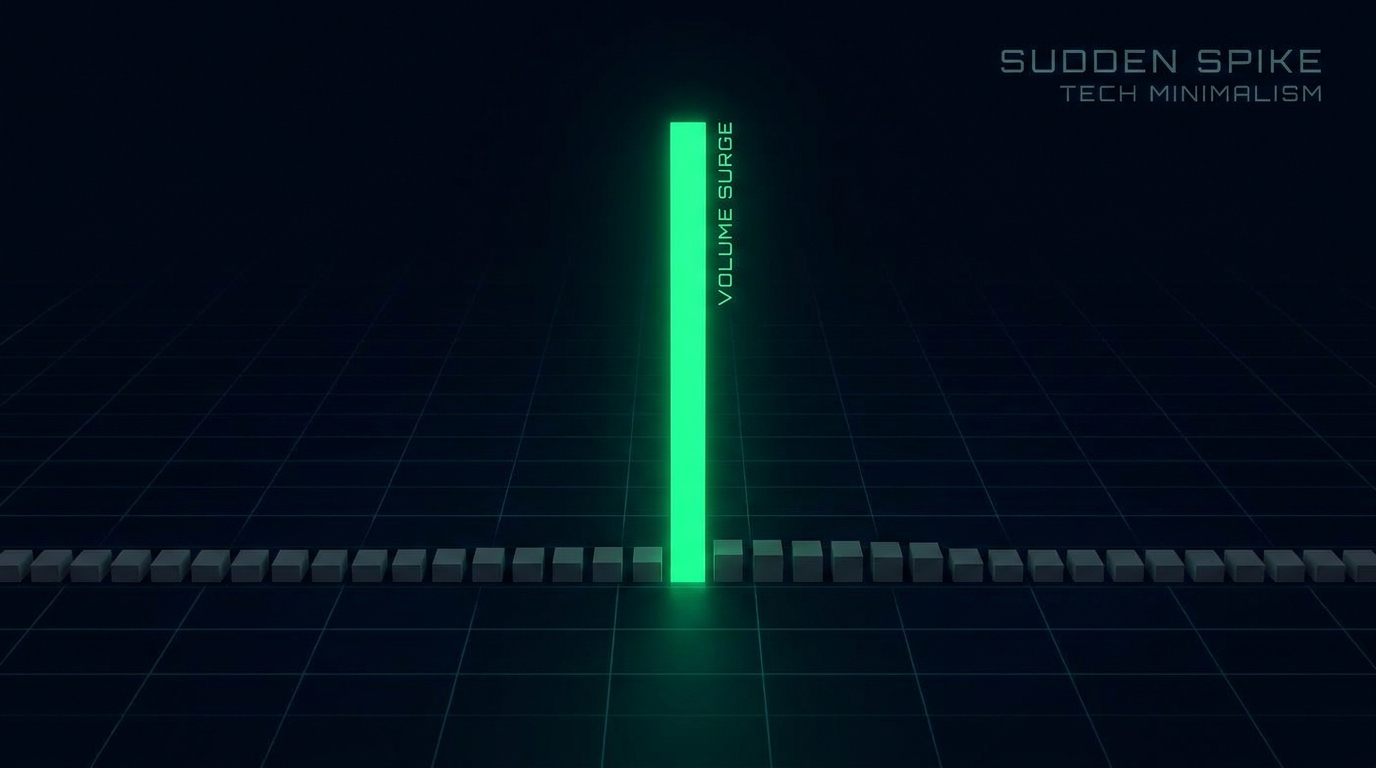
Crypto Volume Spike Scanner API: Catch Unusual Volume First
Price is the last thing to move. By the time a candle breaks out, the volume that caused it has usually been building for hours. Here's how to screen for that instead.
Read more →
Where to Get ETH-USDT Open Interest via API (Binance + Perps)
Binance reported 2,430,666 and Hyperliquid reported 694,339 for the same asset today. Neither number is dollars. Here is the endpoint, the unit conversion, and how to read the trend.
Read more →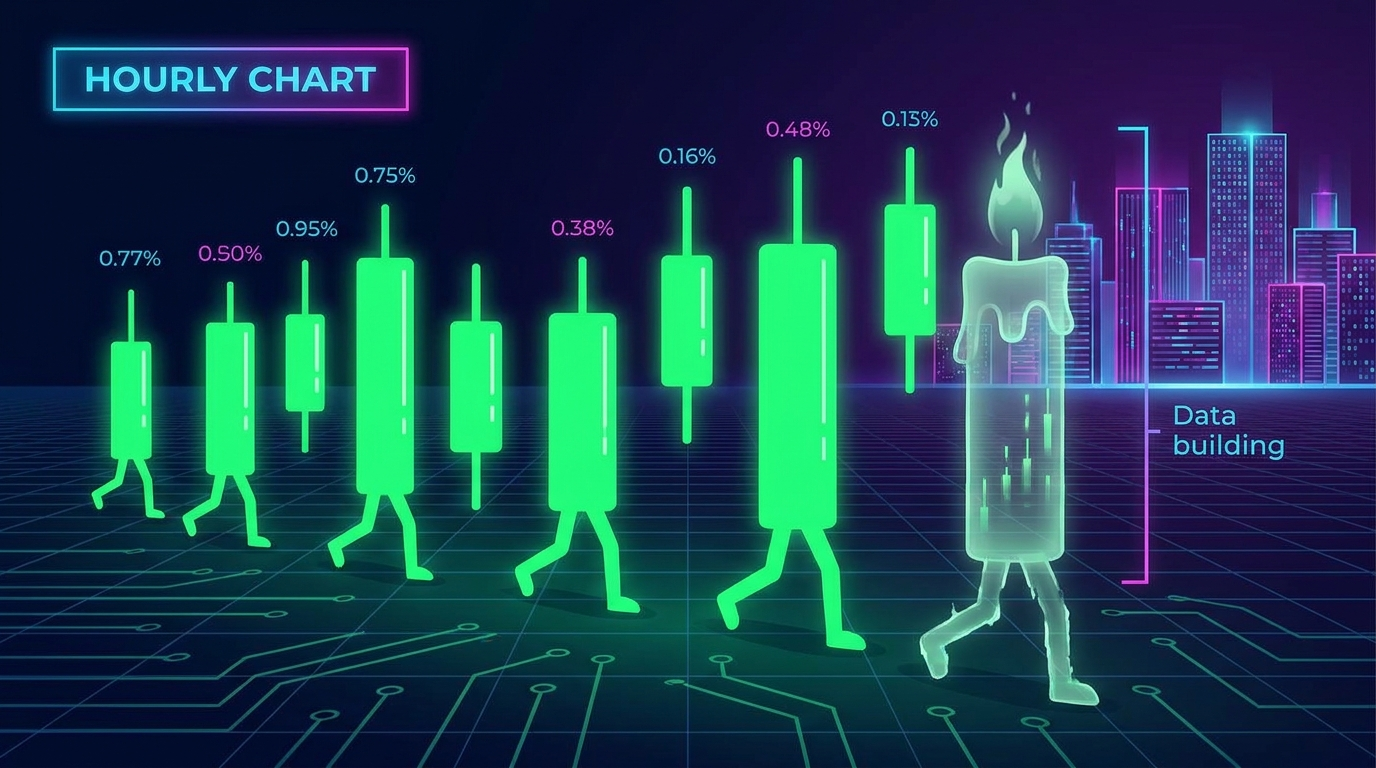
How to Fetch 1h OHLCV Candles for BTCUSDT From a REST API
One GET returns 1,000 hourly bars with eleven fields each. Here is the exact call, what every field means, and the one trap that silently corrupts the last row of every indicator you compute.
Read more →
How to Save Up to 40% on Hyperliquid Trading Fees (Referral + Staking)
Almost nobody pays Hyperliquid's sticker-price fee. Here's exactly how the 4% referral discount and HYPE staking tiers combine — and the volume cap most guides don't mention.
Read more →
Support and Resistance Levels API: Swing Pivots, Not Chart-Squinting
Every chart tutorial tells you to "draw lines where price reversed." That's a judgment call with no two traders agreeing. Here's the same idea as a deterministic pivot-clustering algorithm your bot can call over HTTP.
Read more →
Crypto Token Unlock Calendar API: Dilution Overhang Scored
Unlock lists are everywhere, but most don't say whether the unlock actually matters. This API prices every cliff against a coin's own float and market cap, and admits what it doesn't know.
Read more →
Crypto Short Squeeze Detection API: 23 Minutes Before the News
On 20 August a White House crypto event moved BTC 10% and liquidated billions in shorts. Our news scanner produced zero events. The liquidation tape had already printed a 334x cascade 23 minutes earlier.
Read more →
The Best Free Crypto API in 2026 Is the One Everyone Else Retired
2026 was the year the crypto data industry took free access away. CoinDesk Data retired its free tier outright on 21 May. CoinGlass still has no free API at all. We spent the same year going in the opposite direction — and sizing the free tier around the AI agent instead of the human at a dashboard.
Read more →
Using the Crypto Volatility Index to Increase Trading Profits
Everyone sizes down when volatility spikes. We joined 921 real trades to the daily crypto volatility index, found the opposite - then spent three rounds of testing on 107 wallets watching the answer reverse twice. Here is what survived.
Read more →