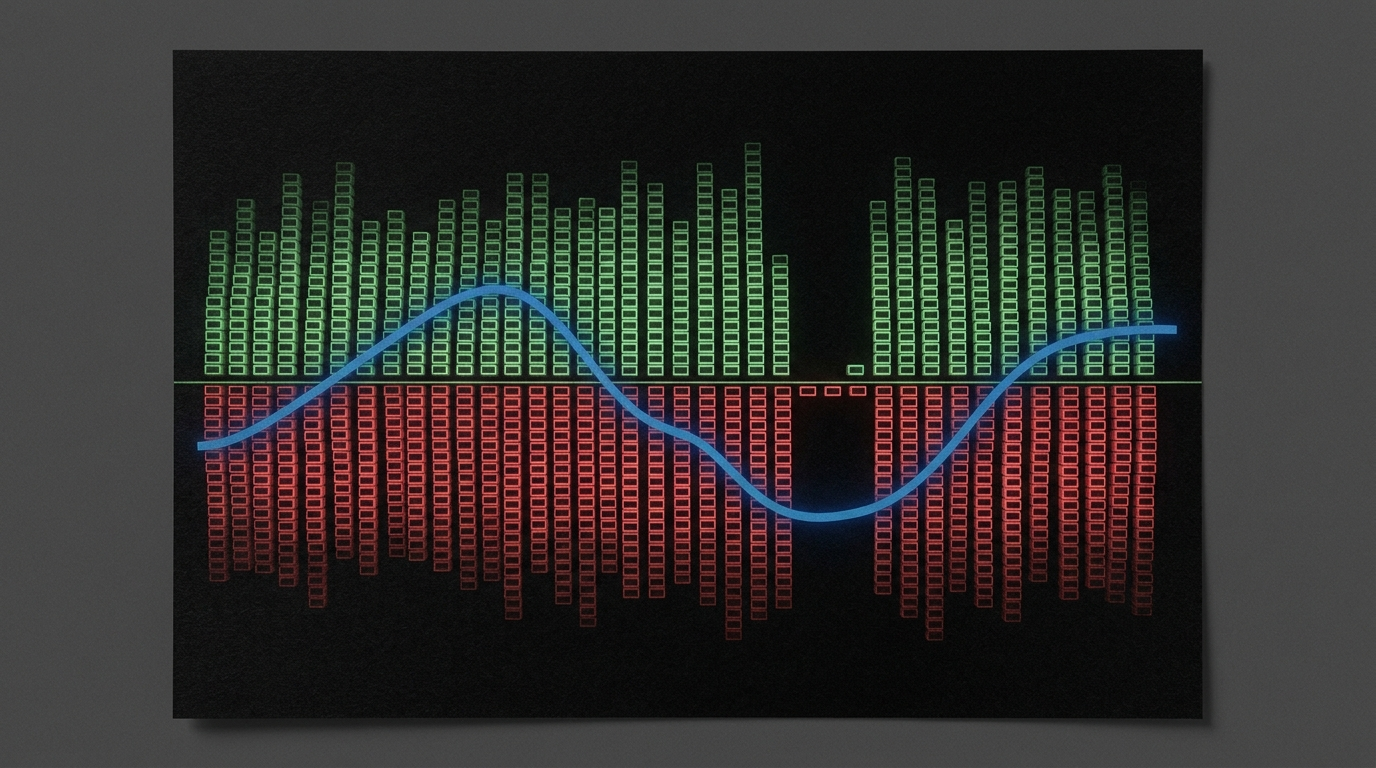
How Is a Liquidation Heatmap Calculated?
People ask how is a liquidation heatmap calculated expecting a formula. For centralised exchanges there is none to publish, because the inputs do not exist. Binance, Bybit and OKX do not expose individual positions or their liquidation prices. A heatmap for those venues is therefore a model: it takes open-interest changes at each candle, assumes a distribution of leverage (commonly buckets such as 10x, 25x, 50x, 100x), computes where each assumed bucket would be liquidated, and accumulates that into a price grid that decays as price moves away. Different vendors choose different buckets and decay rules, which is why two heatmaps of the same market disagree.
That model is useful as a crowding proxy. It is not a measurement. The same question on Hyperliquid has a different answer, because every perp position on Hyperliquid lives on-chain in a public clearinghouse state, with its size, entry, leverage and liquidation price readable by anyone. A Hyperliquid liquidation ladder can be observed, not estimated.
Why Can Hyperliquid's Liquidation Ladder Be Read Instead of Modelled?
Hyperliquid runs its order book and margin engine on its own L1, and the clearinghouseState info request returns, for any address, every open position with its liquidation price. Read enough addresses and you have the real ladder. That is what sits behind /api/v1/quant/positioning/ladder:
- Universe: every Hyperliquid account holding at least $100k in open positions, refreshed about every 5 minutes by the same collector that builds the archived
liquidation_mapsnapshot, so the live read and the history agree. - Grid: liquidation prices are binned on a 0.5%-of-mark grid, clamped to ±50% of mark. Each bin sums the USD notional of longs and shorts that would be liquidated there.
- Classes: a behavioural classifier tags each account
market_maker,whaleorother, so you can strip hedged market-maker inventory out of the picture.
Nothing is assumed about leverage, because the leverage is in the data. The one thing that is a judgment call is the classifier, and its version is published as meta.classifier_version so a change in tagging is distinguishable from a change in the market.
The Observed Ladder: /quant/positioning/ladder
curl -H "X-API-Key: cdk_live_your_key" \
  "https://cryptodataapi.com/api/v1/quant/positioning/ladder?symbol=BTC"
A trimmed example of the shape (values illustrative):
{
  "symbol": "BTC",
  "timestamp": 1761955200000,
  "positions_as_of": 1761955012000,
  "mark": 70400.0,
  "flip": 69150.0,
  "flip_directional": 68800.0,
  "bins": [
    {"price_lo": 68288.0, "price_hi": 68640.0, "long_usd": 41200000.0,
     "short_usd": 0.0, "total_usd": 41200000.0}, "..."
  ],
  "bins_directional": ["..."],
  "bins_by_class": {"market_maker": ["..."], "whale": ["..."], "other": ["..."]},
  "levels": [
    {"price": 69696.0, "dist_pct": -1.0, "total_usd": 58900000.0,
     "side": "long", "n_accounts": 37},
    {"price": 71104.0, "dist_pct": 1.0, "total_usd": 22400000.0,
     "side": "short", "n_accounts": 19}
  ],
  "meta": {"n_levels": 6, "bin_pct": 0.5, "classes": ["market_maker", "whale", "other"],
           "classifier_version": "2026-07-02", "note": "..."}
}
The fields that carry the signal:
bins: all-class density, each{price_lo, price_hi, long_usd, short_usd, total_usd}.long_usdbelow mark is downside fuel;short_usdabove mark is upside fuel.flip: the price where the net liquidation imbalance crosses over, across all classes. It isnullwhen one side is absent or no crossover falls within ±30% of mark. Treatnullas "no meaningful flip", not zero.bins_directional/flip_directional: the same with market-maker and vault accounts removed. Market-maker liquidations are hedged noise; these are the cleaner walls.bins_by_class: the same grid split bymarket_maker,whaleandother; the three sum tobins, and a class with no levels is[].levels: at most six, the three nearest non-empty bins above and below mark, each withdist_pct(signed, negative below),sideandn_accounts. Noten_accountscounts account-positions in the bin, not distinct wallets.
symbol is required, one coin, matched case-insensitively against Hyperliquid names (kPEPE is valid). A coin with no liquidation levels in the active universe is a 404 symbol_not_found; while the collector is warming after a deploy the route returns 503 positioning_warming_up. It is a Pro-tier route.
Who Is Behind the Levels: /quant/positioning
The ladder tells you where. /api/v1/quant/positioning tells you who. For each coin it aggregates long, short, net and gross notional into trader-type buckets, market_maker, whale, other and all, with the distinct account count per bucket and the current mark. Two overlay tags, by_tag.smart_money and by_tag.high_leverage, carry the same {long_usd, short_usd, net_usd, gross_usd, n_accounts} shape but are orthogonal: an account can hold both, either or neither, so they do not sum to all.
curl -H "X-API-Key: cdk_live_your_key" \
  "https://cryptodataapi.com/api/v1/quant/positioning?symbol=BTC,ETH,SOL"
Both routes carry positions_as_of (ms), the completion time of the poll cycle the positions came from, so staleness is never hidden. The coins map is archived every 5 minutes as the positioning snapshot type, forward-only from 2026-09-09.
Read together: a heavy long wall 1% below mark in levels, and a whale bucket that is net long with few accounts, is a different situation from the same wall made of hundreds of other accounts at high leverage. The modelled heatmap cannot make that distinction, because it never knew who held what.
The Ladder as a Time Series: /backtesting/liquidation-density
A heatmap screenshot is a moment. For a backtest you need the density near mark at every point in time, and the full liquidation_map snapshots are about 1 MB each. /api/v1/backtesting/liquidation-density is the compact series: one ~2 KB point per coin per 5-minute snapshot, with time, coin, snapshot_time, mark, and two maps:
long_below: USD of longs whose liquidation price sits below mark, keyed by band half-width in percent:"0.5","1","2","3","5". The bands are cumulative and listed inbands_pct.short_above: the same for shorts liquidating above mark.by_trader_type(vault, market_maker, whale, smart_money, high_leverage, other) andby_leverage(3, 5, 10, 20, 25, 40, 50, 100) hold the same two maps per group and sum to the total. Every key is always present;0means nothing in that band.
curl -H "X-API-Key: cdk_live_your_key" -H "Accept-Encoding: gzip" \
  "https://cryptodataapi.com/api/v1/backtesting/liquidation-density?coin=BTC&start=2026-10-01&end=2026-10-15&interval=1h"
The by_leverage split is the part a modelled heatmap has to assume. Here it is observed: you can see directly how much of the 2% band is 50x and how much is 10x. Three rules from the response's grain block: grain.kind is level_snapshot and sum_ok is false, because these are resting levels, so never sum across rows. interval=1h serves the first snapshot of each hour; 5m serves all of them. The window is at most 93 days per call, with next_cursor / has_more for paging, and coin accepts a comma list of up to 25.
History starts 2026-06-26, when the full-universe feed began. Earlier liquidation_levels snapshots were a ~25-whale sample and are deliberately excluded. This route is Pro Plus.
Modelled Heatmap vs Observed Ladder
| CEX-style modelled heatmap | Hyperliquid observed ladder | |
|---|---|---|
| Input | OI changes per candle, assumed leverage buckets | Every ≥ $100k account's actual positions and liquidation prices |
| Leverage | Assumed distribution | Observed; by_leverage split in the history series |
| Who holds the level | Unknown | bins_by_class, by_trader_type, account counts |
| Market-maker noise | Included, indistinguishable | Separable via bins_directional and flip_directional |
| Decay as price moves | A vendor rule | None needed; a closed position simply leaves the data |
| Vendors agree? | No, different buckets and decay | Same chain state for everyone; only the classifier is ours |
| Coverage gap | Depends on OI feed | Accounts under $100k are not polled |
The right column is not perfect. The $100k floor means the retail tail is missing, and Hyperliquid liquidations themselves are only part of the cross-exchange picture. What it is, is a measurement, with its sampling rule stated.
When to Use This (and When Not To)
Use the observed ladder when you trade Hyperliquid perps and want to know where forced flow will come from in the next few percent: the nearest levels, the side on each, and whether the whale or other class owns them. Use the density series to test whether a dense long_below["1"] actually preceded downside follow-through on your coins before you trade on it. Pair it with the per-fill tape in /backtesting/hl-liquidations to see which levels really got hit; that is the fill-tape post.
Do not use it for:
- Binance or Bybit price targets. This is Hyperliquid's book. A cluster here says nothing about where CEX leverage sits, and a BTC wall on Hyperliquid can be run through by flow on venues ten times its size.
- Sub-$100k crowding. If the thesis is "retail is over-levered", the universe floor excludes exactly the accounts you mean.
- Summing density over time.
sum_okisfalsefor a reason. Compare levels across rows; never add them. - Backtests before 2026-06-26. There is no full-universe history earlier, and we will not fabricate one.
The dealer-only view of the same data, the perp analogue of options gamma, is /quant/gex, covered in the GEX post. Both ladder routes are Pro; the history series is Pro Plus. Plans are on /pricing.
Frequently asked questions
How is a liquidation heatmap calculated on centralised exchanges?
As a model. Exchanges do not expose individual positions, so vendors take open-interest changes at each candle, assume leverage buckets such as 10x to 100x, compute where each bucket would be liquidated and accumulate that into a decaying price grid. Vendors differ because the assumptions differ.
Why is a Hyperliquid liquidation map more accurate?
Hyperliquid positions are on-chain with their liquidation prices readable via clearinghouseState. The ladder at /api/v1/quant/positioning/ladder sums every account holding at least $100k into a 0.5%-of-mark grid, so leverage and liquidation prices are observed rather than assumed.
What does flip mean on the positioning ladder?
The price where the net liquidation imbalance crosses over across all account classes. It is null when one side is absent or no crossover falls within 30% of mark, which means no meaningful flip rather than zero. flip_directional excludes market makers and vaults.
Can I get Hyperliquid liquidation density as a time series?
Yes. /api/v1/backtesting/liquidation-density returns one point per coin per 5-minute snapshot with long_below and short_above maps for 0.5, 1, 2, 3 and 5 percent bands, split by trader type and leverage. History starts 2026-06-26 and the route is Pro Plus.
Does the ladder include every Hyperliquid account?
No. It covers every account with at least $100k in open positions, refreshed about every 5 minutes. Smaller accounts are not polled, so the retail tail is absent from the levels.