How do I fetch 1h OHLCV candles for BTCUSDT?
One authenticated GET. To fetch 1h OHLCV candles for BTCUSDT, call /api/v1/market-data/klines with the symbol, the interval and how many bars you want:
curl -H "X-API-Key: cdk_live_YOUR_KEY" \
  "https://cryptodataapi.com/api/v1/market-data/klines?symbol=BTCUSDT&interval=1h&limit=2"
The response is already parsed into named fields — no positional arrays to decode:
{
  "symbol": "BTCUSDT",
  "interval": "1h",
  "klines": [
    {
      "open_time": 1787742000000,
      "open": 78727.46,
      "high": 78782.0,
      "low": 78317.0,
      "close": 78487.26,
      "volume": 413.44093,
      "close_time": 1787745599999,
      "quote_volume": 32467808.9018965,
      "trades": 144198,
      "taker_buy_base_volume": 199.88935,
      "taker_buy_quote_volume": 15698362.5209286
    }
  ],
  "count": 2
}
That is the whole integration. symbol accepts any Binance spot pair, interval runs from 1m to 1M, and limit tops out at 1,000 bars per request. Candles are on the free tier — no card, no gate.
Every field in the candle, explained
Most OHLCV feeds hand you six numbers. This one returns eleven, and the extra five are the ones worth having — they let you separate real participation from wash-like volume without a second call.
| Field | Type | What it is |
|---|---|---|
open_time | int (ms) | Unix epoch in milliseconds when the bar opened. This is the bar's canonical timestamp. |
open | float | First trade price in the bar. |
high / low | float | Extremes touched during the hour. |
close | float | Last trade price. On the newest bar this is the live price, not a settled one. |
volume | float | Base-asset volume — in BTC for BTCUSDT. |
close_time | int (ms) | Last millisecond of the bar. Always open_time + 3599999 for 1h. |
quote_volume | float | Quote-asset volume — USDT turnover. Use this, not volume, to compare across coins. |
trades | int | Number of individual trades. Volume ÷ trades gives average trade size. |
taker_buy_base_volume | float | Volume where the buyer was the aggressor. |
taker_buy_quote_volume | float | Same, in USDT. |
The last two are the cheapest order-flow proxy in crypto. In the bar above, taker buys were 199.9 of 413.4 BTC — a 48.3% buy ratio, so sellers were marginally the aggressors while price fell from 78,727 to 78,487. That read costs you zero extra requests.
Intervals, limits, and how far back one call reaches
limit caps at 1,000, so the interval decides your lookback. One call, one interval, one window:
interval | 1,000 bars covers | Typical use |
|---|---|---|
1m | ~16.7 hours | Intraday microstructure, execution studies |
5m | ~3.5 days | Scalping signals, short-horizon features |
15m | ~10.4 days | Intraday trend, session structure |
1h | ~41.7 days | The default swing-trading resolution |
4h | ~166 days | Multi-week structure, regime context |
1d | ~2.7 years | Cycle work, long-horizon backtests |
So a single interval=1h&limit=1000 call gives you roughly six weeks of hourly history — enough to seed a 200-period moving average, an RSI, or an ATR with room to spare.
If you need more than 1,000 hourly bars, do not loop the endpoint with offsets. Drop to 1d for the long arm of the series, or use the minute-resolution archive covered further down.
The partial-candle trap that corrupts your last data point
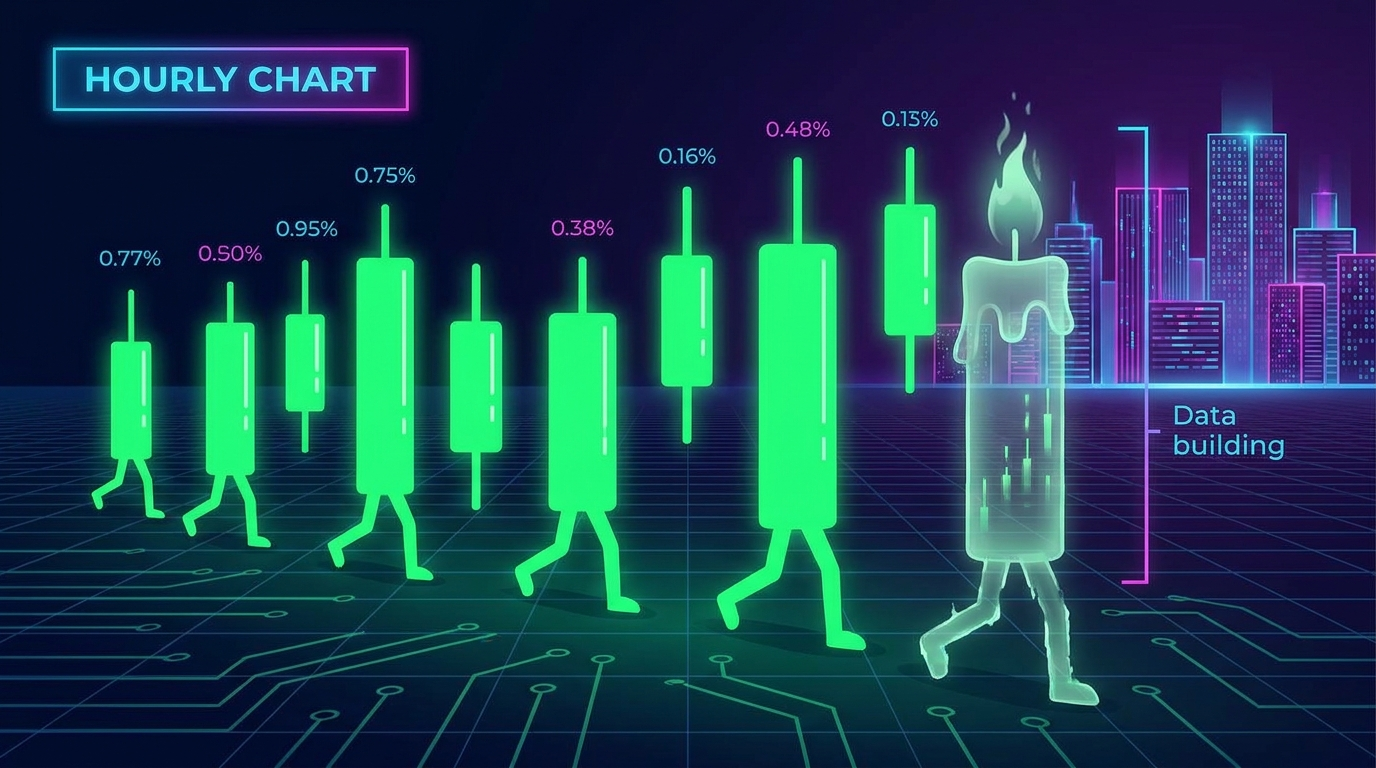
Here is the bug that shows up in almost every first integration. The newest bar in the response is still open. Its close is the current price, its volume is an hour-to-date running total, and both will change before the hour ends.
Take the second bar from the call above: open_time 1787745600000, close_time 1787749199999. At the moment of the request the clock read 1787747651499 — sitting inside that window, roughly 34 minutes into a 60-minute bar. Its reported volume of 675 BTC was 34 minutes of trading, not an hour of it.
Feed that row into a moving average and the average is wrong. Feed it into a volume-spike detector and it under-reads by up to 98% at the top of the hour, then snaps up. Feed it into a backtest and you have leaked the future into your training data.
The fix is two lines. Compare close_time against the wall clock and drop anything that has not settled:
import time

now_ms = int(time.time() * 1000)
settled = [k for k in data["klines"] if k["close_time"] < now_ms]- For indicators and backtests — always drop the open bar. A wrong last point poisons every rolling window it touches.
- For live dashboards — keep it, but label it. Traders expect the current bar to move.
- Never mix the two in one series. That is how a strategy backtests beautifully and loses money live.
Ask for limit=201 when you need 200 settled bars. The extra row is the one you throw away.
Loading BTCUSDT candles into a pandas DataFrame
The named-field shape means the DataFrame construction is a one-liner. No column lists, no positional index guessing:
import time
import pandas as pd
import requests

API_KEY = "cdk_live_YOUR_KEY"
BASE = "https://cryptodataapi.com/api/v1"


def get_candles(symbol="BTCUSDT", interval="1h", limit=500, settled_only=True):
    r = requests.get(
        f"{BASE}/market-data/klines",
        params={"symbol": symbol, "interval": interval, "limit": limit},
        headers={"X-API-Key": API_KEY},
        timeout=15,
    )
    r.raise_for_status()
    rows = r.json()["klines"]

    if settled_only:
        now_ms = int(time.time() * 1000)
        rows = [k for k in rows if k["close_time"] < now_ms]

    df = pd.DataFrame(rows)
    df["time"] = pd.to_datetime(df["open_time"], unit="ms", utc=True)
    return df.set_index("time").sort_index()


df = get_candles(interval="1h", limit=501)
df["ret"] = df["close"].pct_change()
df["taker_buy_ratio"] = df["taker_buy_base_volume"] / df["volume"]
df["vwap"] = df["quote_volume"] / df["volume"]

print(df[["close", "vwap", "taker_buy_ratio"]].tail())
Three derived columns, zero extra API calls. vwap falls straight out of quote_volume / volume, and taker_buy_ratio above 0.5 means buyers were lifting offers during the bar.
Every response also carries your budget in the headers — x-ratelimit-remaining-minute and x-ratelimit-remaining-day — so a polling loop can back off on its own instead of discovering the ceiling with a 429.
BTCUSDT vs BTC: spot candles vs perp candles
BTCUSDT is a Binance spot pair. If what you actually want is the perpetual futures candle — the instrument most crypto strategies trade — the symbol is just BTC and the endpoint is different.
| Spot candles | Perp candles | |
|---|---|---|
| Endpoint | /market-data/klines | /hyperliquid/candles |
| Symbol param | symbol=BTCUSDT | coin=BTC |
| Venue | Binance spot | Hyperliquid perps |
| Fields per bar | 11 | 6 (timestamp, OHLC, volume) |
| Bar timestamp key | open_time | timestamp |
| Has funding / OI | No — spot has neither | Yes, via the derivatives endpoints |
Passing BTCUSDT to the Hyperliquid endpoint returns nothing useful, and passing BTC to the spot endpoint is not a listed pair. This naming mismatch is the single most common integration error against any multi-venue crypto API. Pick your venue first, then the symbol format follows.
Practical rule: use spot candles for price history and indicators, use perp candles when your fills happen on the perp — basis between the two is real and occasionally large.
When 1,000 bars isn't enough: the minute archive
The /klines endpoint is a trailing window. For a range query — "every minute of BTCUSDT between two dates" — there is a separate archive endpoint backed by our own stored history, not a passthrough:
curl -H "X-API-Key: cdk_live_YOUR_KEY" \
  "https://cryptodataapi.com/api/v1/backtesting/klines\
?symbol=BTCUSDT&exchange=binance\
&start=2026-08-01T00:00:00Z&end=2026-08-08T00:00:00Z\
&limit=10000&format=csv"
Three differences that matter:
- Resolution is fixed at 1m. Aggregate up to 1h yourself — a 1h bar is 60 minute bars grouped by
floor(time / 3600000). - The range is half-open:
[start, end).endis exclusive, so consecutive windows tile without duplicating a boundary row. Paginate by setting the nextstartto the previousend. format=csvstreams. For a multi-day pull that is dramatically cheaper to parse than JSON, and it drops straight intopandas.read_csv.
This endpoint is Pro Plus, with a limit ceiling of 10,000 rows per call. The trailing-window /market-data/klines stays free.
Which call to make, when
Four situations, four answers:
- "I need the last N hours of BTCUSDT for an indicator." →
/market-data/klines?symbol=BTCUSDT&interval=1h&limit=N+1, then drop the open bar. Free tier, one call. - "I need the current price, right now." → Not a candle call. Use
/market-data/ticker/price?symbol=BTCUSDT— smaller payload, no bar semantics to reason about. - "I'm backtesting a strategy over a fixed date range." →
/backtesting/klineswithformat=csvand explicitstart/end. Never reconstruct a range by looping a trailing window. - "My agent needs candles plus funding plus open interest." → Candles from
/market-data/klines, the rest from/derivatives/summary?coin=BTC, which returns funding, OI and long/short in a single response.
A sane polling cadence for 1h bars is once per hour, a minute or two after the top of the hour. Anything faster re-fetches a bar that has not changed. On the free tier's 1,000 requests/day that leaves you 976 requests for everything else.