A Point Forecast Hides the Only Thing That Matters: Risk
"BTC will be up 0.5% tomorrow" is a useless number for an automated trader. It says nothing about how wrong it could be — and position sizing, stop placement and leverage all depend on the shape of what could happen, not the midpoint.
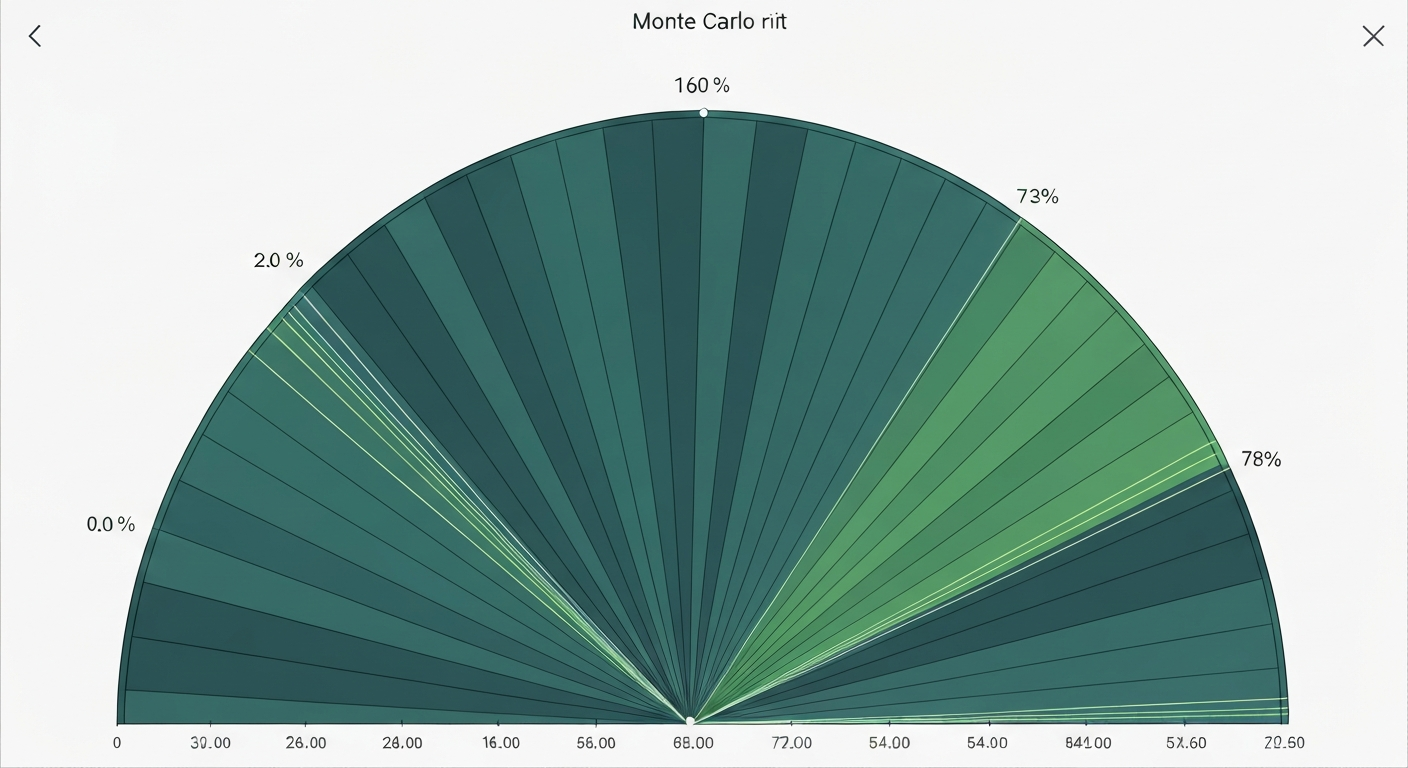
The quant engine's Monte Carlo "tomorrow" block replaces the point forecast with a full distribution. Every hour it runs 1,000 simulated 24-hour paths off the live regime and returns the percentile bands of cumulative return, the probability of a volatility spike, and the probability of a drawdown beyond 5% — the numbers you actually size risk against.
It ships inside /api/v1/quant/market (and per coin), so one call gives you both the regime and its forward risk distribution.
The 'Tomorrow' Block: A Distribution, Not a Number
The tomorrow object summarizes 1,000 paths into the fields a risk engine needs:
| Field | Meaning |
|---|---|
cum_return_quantiles.p5 | 5th-percentile 24h return — your realistic downside case |
cum_return_quantiles.p50 | Median outcome |
cum_return_quantiles.p95 | 95th-percentile upside |
p_drawdown_gt_5pct | Probability of a >5% intraday drawdown over the path |
p_visit_vol_spike | Probability the path passes through a volatility-spike regime |
n_paths / horizon_hours | Simulation size (1000) and horizon (24) |
The gap between p5 and p95 is the engine's implied range for tomorrow — wide in vol_spike, tight in range_low_vol.
What Are the Odds of a Drawdown Tomorrow?
Pull the block straight off the market endpoint:
curl -H "X-API-Key: cdk_live_your_key" \
  "https://cryptodataapi.com/api/v1/quant/market?horizon=24h"
"tomorrow": {
"n_paths": 1000,
"horizon_hours": 24,
"cum_return_quantiles": {
"p5": -0.0528, "p50": 0.0007, "p95": 0.0518
},
"p_visit_vol_spike": 0.20,
"p_drawdown_gt_5pct": 0.106
}Read it plainly: the median day is flat (+0.07%), but the 5th percentile is −5.3%, there's a 20% chance of touching a volatility spike, and a ~11% chance of a 5%+ drawdown. That last number is the one a risk manager acts on — an 11% tail is a very different day than a 2% tail, even with the same flat median.
How the Simulation Works
The Monte Carlo isn't a black box — it's driven by the same HMM that scores the regime:
- Start from the live state. Paths are seeded from the current regime posterior, so the simulation inherits today's market state.
- Step the transition matrix. Each hour, the path hops between regimes according to the learned transition probabilities.
- Sample per-state returns. At each step it draws an hourly return from that state's fitted return distribution, accumulating over 24 hours.
- Deterministic seed. The
seedis derived from the bar timestamp, so the same bar always returns the same numbers — reproducible and cacheable, no flicker between identical requests.
Because it walks real regime dynamics, a squeeze path can break into a trend and a range path can stay pinned — the tails come from the model, not a fixed Gaussian assumption.
Distribution vs Point Forecast
Why the distribution wins for automated trading:
- Point forecast: "+0.5% expected." Can't set a stop, can't size to risk, can't tell a calm day from a fragile one.
- Percentile bands: place stops near
p5, size to the p5–p95 width, scale leverage inversely to the range. - Tail probabilities:
p_drawdown_gt_5pctis a direct de-risking trigger — cut exposure when the tail fattens, before the move.
Same median, different p5 = different trade. The distribution makes that visible; a point estimate erases it.
How AI Agents Use the Distribution
Concrete wiring for a risk-aware agent:
import httpx
m = httpx.get("https://cryptodataapi.com/api/v1/quant/market?horizon=24h",
              headers={"X-API-Key": "cdk_live_your_key"}).json()
t = m["tomorrow"]
p5 = t["cum_return_quantiles"]["p5"]

# vol-target sizing: smaller size when the downside band is wide
size = target_risk / abs(p5)

# hard de-risk when the drawdown tail fattens
if t["p_drawdown_gt_5pct"] > 0.20:
size *= 0.5- Position sizing: scale notional to the p5–p95 range (narrow = size up, wide = size down).
- Stop placement: anchor stops to
p5rather than an arbitrary percentage. - Leverage governor: cap leverage when
p_visit_vol_spikeorp_drawdown_gt_5pctis elevated.
Pair it with the regime probabilities for the state and the transition view for what's coming next.